What the Profitability page shows
The Profitability page breaks down revenue, costs, and margin across your company — by job, customer, route, and technician. Pick a date range with the presets at the top: Last 7 Days, Last 30 Days, Last 90 Days, or All Time. "Last N Days" means exactly N calendar days including today, the same window the Overview dashboard uses.
KPI cards and the cost breakdown
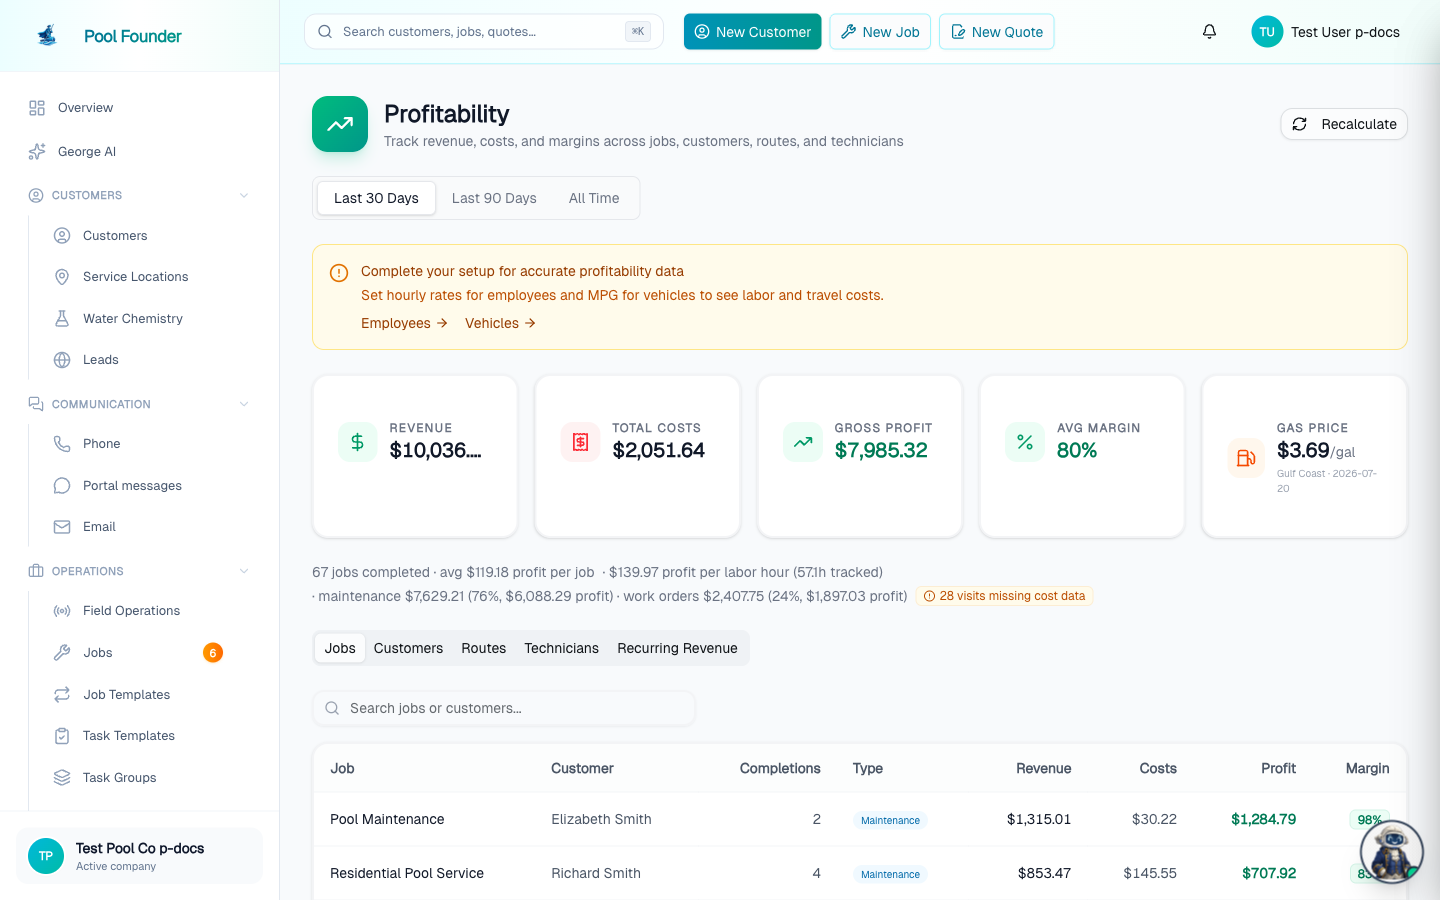
- Revenue — what was earned in the period.
- Total Costs — hover the card for the breakdown: Chemicals / Parts / On-Site Labor / Driving Labor / Mileage / Processing Fees (card fees your company absorbed) / Job Costs (expenses you logged on a visit, below).
- Gross Profit — the top-line profit. When a monthly overhead is configured, the card also shows "− overhead → net" underneath, so you see true net profit too.
- Avg Margin and the current regional Gas Price.
Below the cards: jobs completed, average profit per job, profit per labor hour, and — when some completions have no labor time or mileage recorded — an amber "visits missing cost data" chip. Hover the chip to see why data is missing.
Until every active technician has an hourly rate and every vehicle has a Cost per Mile or MPG, the page shows a setup banner: "Complete your setup for accurate profitability data — Set hourly rates for employees and MPG for vehicles to see labor and travel costs", with links to the Employees and Vehicles pages. It disappears on its own once those rates are filled in.
The Over Time tab: weekly profit and what you earn per hour
The Over Time tab is the first tab under the summary and opens by default. It answers "how much did I make last week?" and "what am I making per hour?" for the selected date range.
- Three tiles at the top — Last week (Monday–Sunday, with a "+12% vs prior" chip comparing revenue to the week before), This week so far, and Selected range. Each shows profit as the headline, then revenue, visits, tracked hours, and profit per hour and revenue per hour. The week tiles always show calendar weeks, whatever grain the chart is on.
- A bar chart with two switches: the metric — Profit, Revenue, Profit / hr, or Revenue / hr — and the grain — Daily, Weekly, or Monthly. Last 7 Days opens on Daily, Last 30 Days and Last 90 Days on Weekly, and All Time on Monthly. The bar for the current period is lighter because it is still in progress; hover any bar for revenue, costs, profit, hours, visits, and both per-hour figures.
- A table, most recent period first, with Period, Visits, Revenue, Costs, Profit, Margin, Hours, Revenue / hr, and Profit / hr. Periods with no visits and no tracked time are left out.
Hours on this tab are tracked route time from the technician app — time on site plus driving, with pauses removed — not hours reconstructed from pay rates. That is why per-hour figures work even when nobody on the team has an hourly rate set. Visits logged manually (not through a route) count toward revenue but carry no time, and a period with no tracked time shows a dash instead of a per-hour number.
Weeks run Monday through Sunday. Revenue and costs use the same visit-based attribution as the rest of the page, so a week's revenue here matches the Jobs and Customers tabs for the same days. There is no export from this tab.
Gross profit vs net profit
The top-line number is Gross Profit. To get closer to true net profit, two optional settings live in Payroll → Settings (the popover at the top right of the Payroll page):
- Labor burden % — payroll taxes, workers' comp, and similar on-costs, added on top of labor costs.
- Monthly overhead $ — shown as an overhead line in the profitability summary, turning gross profit into net.
How revenue is attributed
Revenue is attributed to match what's actually invoiced, not a naive per-visit rate:
- Monthly and weekly flat rates are split across the month's visits.
- Work-order discounts are netted out.
- On jobs where chemicals are partially included, only the billed overage counts as chemical revenue.
- Sales tax is left out. Tax charged on chemicals, parts, and taxable line items is owed to the state, not earned, so revenue uses the pre-tax amount. The Invoiced Amount and Collected Amount cards on the Overview dashboard still include tax, since that's what customers were billed and paid.
Vehicle and mileage costs
- Enter an all-in Cost per Mile ($) on the vehicle (vehicle form) and it overrides everything.
- Or enter just MPG and the system computes a fuel-only cost from weekly regional gas prices.
- When both are set, the Mileage cost is split into Fuel (miles × gas price ÷ MPG) and Vehicle wear & depreciation (the rest of the all-in rate) — shown in the Total Costs tooltip and on route detail pages, so you can see actual gas spend separately from wear.
Miles per route come from odometer readings, GPS, or estimates — tracked automatically alongside clock-in/out (see Employees, time & payroll).
Job costs: expenses that are not parts or chemicals
Some money you spend on a job is not a catalog part and not a chemical — a pump bought off the shelf at a supply house, a dump fee, a subcontractor, an equipment rental. Record those as Job costs on the visit: open the job, expand the visit under Visit history, and use Edit on the Job costs block (the same block is on the visit's full detail page). Give each one a description and an amount.
- Job costs are never billed to the customer. They do not appear on an invoice or a service report — they only reduce that visit's profit. To charge the customer for something, use a part, a chemical, or a work order line item instead.
- They can be added after the job has been invoiced, even after the invoice has been paid. Parts and chemicals lock at invoicing because they change what is billed; job costs do not, so a receipt that turns up late can still be recorded against the right job.
- They roll into Job Costs in the Total Costs breakdown, and into the cost pie on the job, customer, route, and technician detail pages.
Anything you stock and bill still belongs in your Parts catalog instead — those price from the catalog and carry their own Your Cost per Unit. Job costs are the catch-all for everything else.
The tabs: Jobs, Customers, Routes, Technicians, Chemicals
Below the summary, the Over Time tab (covered above) opens first. The next tabs break profitability out into sortable profit tables by Jobs, Customers, Routes, and Technicians — click any row for its detail page. Two more tabs, Chemicals and Recurring Revenue, are covered below.
The Technicians tab also has a muted Tips column. Tips are pass-through gratuities that belong to the technician, so they are shown for reference only — they are never counted in revenue, profit, or margin. See tips and gratuities.
Wherever a margin appears, a job or period with costs but no revenue shows a red dash instead of a percentage — that's a loss, not a break-even "0%".
Drill down: overview pages, runs, and per-stop costs
- Jobs tab → job overview page. Clicking a job row opens an aggregate page for that job — Revenue, Costs, Profit, Margin, and Completions cards, a Profit Over Time chart, a Cost Breakdown donut, and an Individual Completions table. Each completion row clicks through to a single-visit detail page with its own cost details and the exact chemicals and parts used. The same page is reachable from a job's View Details link on its Profitability card.
- Routes tab → route overview page. Clicking a route row opens the aggregate for that route — the same cards plus Runs and Miles, and an Individual Runs table listing every time the route was driven. Each run clicks through to a route-run detail page.
- Route-run page → Stop Details. A run's page shows cost tiles (Chemicals, Parts, On-Site Labor, Driving Labor, Mileage, Processing Fees) and a Stop Details table. Stops with recorded usage have an expander that opens the per-stop cost detail: the chemicals used, the parts used, and time at the stop.
- When a vehicle has both Cost per Mile and MPG set, the run's Mileage tile splits the cost into fuel and wear & depreciation — e.g. "$4.10 fuel + $6.20 wear & depreciation".
Customer and Technician rows drill down the same way, each with its own charts and an Individual Jobs table.
The Chemicals tab
The Chemicals tab turns the Chemicals line of the cost breakdown into a company-wide report for the same date range: a Chemical spend over time chart with Spend at Cost, Billed, and Margin totals, and a sortable table of every chemical used — Chemical, Quantity, Spend at Cost, Billed, Margin (with its percentage), and Visits. Click a row to open that chemical's Insights tab.
- Spend at Cost is what you paid (your weighted average cost); Billed is what customers were charged. A chemical included in a monthly rate bills $0 on its own, so its margin reads as the full cost — the profit is in the service rate.
- A chemical recorded under a name that is not in your Chemicals catalog still appears, tagged not in catalog, and its row does not link anywhere.
- On this tab, All Time reaches back at most 24 months; when the range is longer the footer says "· last 24 months".
Full detail — the per-chemical Insights tab, stock runway, and the Chemical Usage & Cost sections on customer, job, location, and pool pages — is in chemical usage and cost analytics.
The Recurring Revenue (MRR) tab
The Recurring Revenue tab shows current MRR, annual run rate, the count of recurring customers, and a breakdown by billing type. The rules:
- MRR counts maintenance jobs that are on active routes: flat monthly/weekly rates, plus per-visit rate × route frequency for per-visit jobs.
- A job with a rate but no route has no recurring schedule and is excluded — the tab shows a count of these so they aren't invisible.
- Route assignments that already ended don't count.
- Work orders are one-time revenue and are never in MRR.
The annual run rate is seasonal-aware: jobs with seasonal schedules sum each segment's rate × frequency across the year, instead of projecting the current season × 12 — so a summer-heavy book isn't overstated in July or understated in January.
- Realized Recurring Revenue — a 12-month chart that stacks recurring (maintenance) vs one-time (work order) revenue, so the mix is visible. The current month is shown lighter because it's still in progress. The Profitability summary also shows a maintenance vs work-order revenue and profit split.
- MRR Movement — new vs churned customers month over month, counting recurring revenue only.
The Recalculate button
Recalculate (top right) recomputes all profitability data. Use it after fixing the inputs — correcting odometer readings, updating chemical costs or hourly rates, or changing the labor burden % — so the numbers reflect the fixes.
There's also a per-run Recalculate button on each route-run detail page. A run's numbers are normally computed once, when the route is completed — if you fix that run's odometer readings or the vehicle's MPG, cost per mile, or gas data afterwards, click Recalculate there to refresh just that run ("Mileage and costs will refresh in a moment").
Frequently asked questions
How do I see how much money I made last week?
Open Profitability and stay on the Over Time tab (it opens first). The Last week tile shows Monday–Sunday profit, revenue, visits, tracked hours, and profit and revenue per hour, with a chip comparing revenue to the week before. Switch the chart to Weekly to see every week in the range, or Daily and Monthly for those grains.
How do I see what I make per hour?
The Over Time tab on Profitability shows Profit / hr and Revenue / hr on the week tiles, on the chart (pick that metric), and in the table for every day, week, or month. Hours are tracked route time from the technician app, so it works even before pay rates are set — but visits logged manually carry no time, and periods with no tracked time show a dash.
Why is a job with a rate missing from MRR?
MRR only counts maintenance jobs on active routes. A job with a rate but no route assignment has no recurring schedule, so it's excluded — the Recurring Revenue tab shows a count of excluded jobs so you can spot them.
Can I add costs to a job that has already been completed or invoiced?
Yes, as Job costs. Open the job, expand the visit under Visit history, and click Edit on the Job costs block (or use the Job Costs section on the visit's full detail page). Job costs are internal — they never bill the customer — so unlike parts and chemicals they can be added or changed after the work order has been invoiced and even after the invoice is paid. Parts and chemicals themselves lock at invoicing, because those change what the customer was billed.
Can I add a part to a visit after the technician finished it?
Yes, as long as the visit has not been invoiced. Open the job, expand the visit under Visit history, and click Edit on the Parts block — you can add parts there even if the technician logged none. Once the visit (or, for a work order, the job) has been invoiced, parts are frozen; record the spend as a Job cost instead.
What does the amber "visits missing cost data" chip mean?
Some completions in the period have no labor time or mileage recorded, so their costs are incomplete. Hover the chip to see why.
I fixed an odometer reading / hourly rate — why didn't the numbers change?
Click Recalculate (top right of the Profitability page). It recomputes all profitability data and is meant for exactly this — after fixing odometer readings, chemical costs, hourly rates, or the labor burden %.
Where do I set labor burden and overhead?
Payroll → Settings (the popover at the top right of the Payroll page). Labor burden % loads payroll taxes and workers' comp onto labor costs; monthly overhead $ appears as a line in the profitability summary for true net profit.